Explorer and tools
When the report isn't enough, dig in yourself
The Explorer shows every lap and every channel. Jump there from a report or go looking for insights yourself. Plus tools for tyres, circuits and the team in the garage.
Jump into the data
- Click the numberIn the report, underlined numbers are links.
- Land in the ExplorerYou see the laps used in the comparison and where the number comes from.
- Look deeperCompare further channels next to the delta to get to the bottom of the number.
The Explorer
Pick a lap and a reference, and the charts are ready.
The Explorer names the corners that cost the most
Below the legend you find the key findings of the driver report: the corners where your best lap loses the most time and the corners where you lose the most on average. One click loads the matching laps and zooms in on the corner.
The arrows take you through the lap corner by corner. At each corner you see the time through it and the difference to the comparison lap.
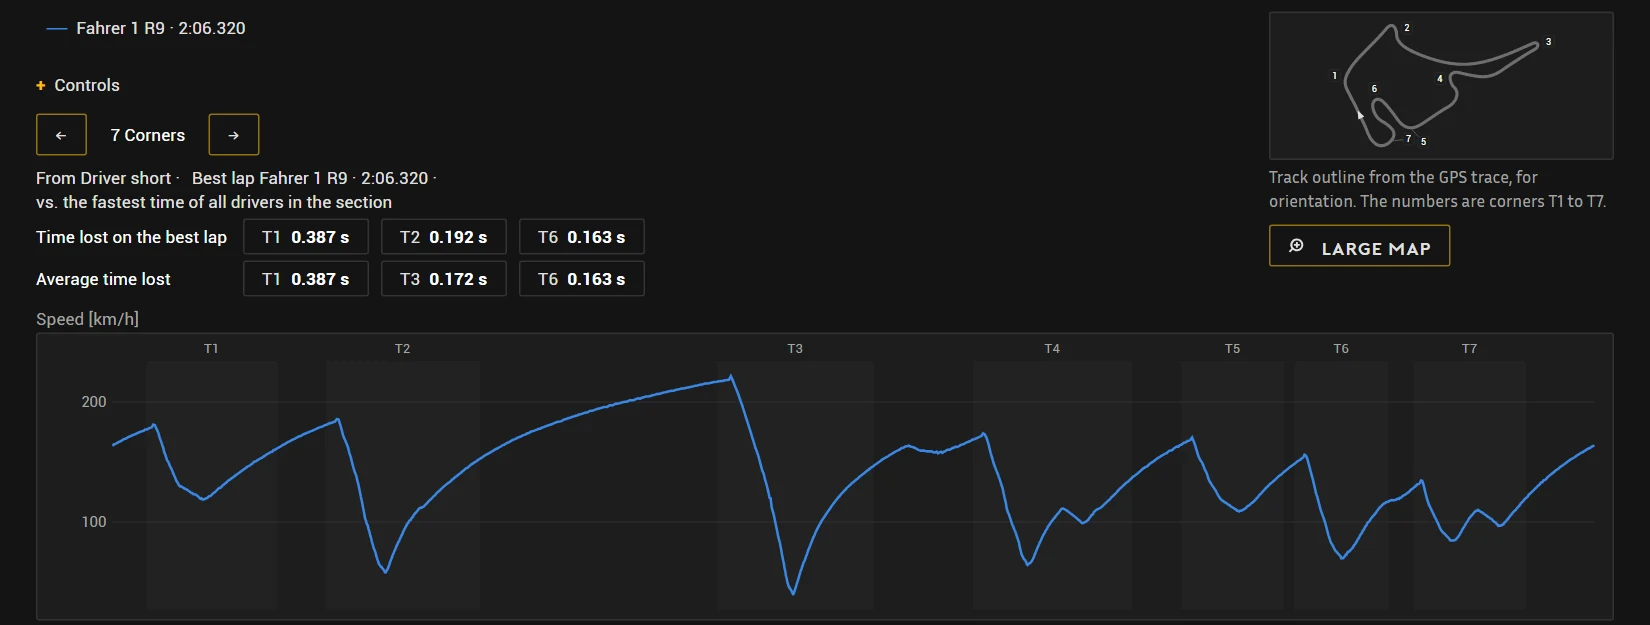
Try it: pick a corner
Two real laps of Zandvoort. The numbers are calculated in your browser from the same data the Explorer uses.
New in PITLENS
Your ideal lap as onboard video
From all the laps PITLENS builds the perfect lap and plays the matching VBOX onboard, each sector from the lap that was fastest there. You see what the optimal way to drive this circuit would really be. As far as we know, no other analysis software does this yet.
- Find the fastest sectorsFor every part of the track PITLENS finds the lap with the best time, from your laps or the team's.
- Cut the onboard togetherThe matching pieces of the VBOX videos play one after another, and at each sector boundary the footage cuts to the next lap.
- With the data alongsideBelow the video you see how many laps the sectors come from, the time they add up to, and which lap is playing right now.
New in PITLENS
Your onboard with your own HUD
PITLENS puts speed, gear, pedals, lap time and track map from the data file over your VBOX video and renders a file you can share. How the HUD looks is up to you.
Try it: pick a layout
The same section of the Nürburgring, rendered six times by PITLENS. In the app you switch the layout with one click, just like here.
Five of the layouts that ship with PITLENS and one we built ourselves in the clip below. In every frame the values come from the lap's data file.
Build your own layout
- Start from a layoutSix layouts are included. You can move every element in the picture, drag it bigger or smaller, recolour it or remove it.
- Write your own widgetIf something is missing, you write a widget in HTML and CSS. PITLENS fills placeholders for speed, gear and the other values from the data file in every frame.
- Save and reuseYour widget goes into the library and can be inserted into any layout. You save the layout under your own name.
Further elements are the pedal trace with ABS and traction control, tyre and brake temperature per wheel, best and last lap and the speed through the corner. If you like, PITLENS renders two laps side by side into one file.
Projecting tyre wear
You enter four tread depths per tyre before and after the stint. From that PITLENS works out the wear per lap and per 100 km and shows how many laps the set has left.
Try it: pick a wheel
One set from the Norisring, 16 laps. Set how long the next stint will be and at which tread depth the tyre has to come off.
Tools for the race weekend
Tyre pressures, wear, weather, corners, lap selection and the team in the garage: each has its own tool.
Join in: the beta starts this winter
PITLENS is built for drivers, engineers, coaches and teams. Start your free trial this off-season and secure one of the limited places now.
We only use your address for news about the beta and the launch of PITLENS. More in our privacy policy.
- TodayVersion 0.7.0 already has plenty of testing and race kilometres behind it.
- Winter 2026/27Free beta for selected teams and drivers.
- Season 2027PITLENS launches and is available as a licence. The most active testers and the people on the list hear first.
- After thatPITLENS keeps growing with new features and stays your reliable partner at the track.